
Yesterday, in response to the impact of COVID-19 on workers, the federal government announced the new Canada Emergency Response Benefit (CERB), which replaces the short-lived Emergency Care Benefit and almost completely replaces Employment Insurance with a flat $2,000 a month payment ($462 a week). The CERB is available to anyone who says they’ve lost all of their income because of COVID-19, regardless of reason, EI eligibility, previous pay, or part-time or full-time status. If you were one of the almost one million people who applied for EI last week, your application is redirected to the CERB automatically.
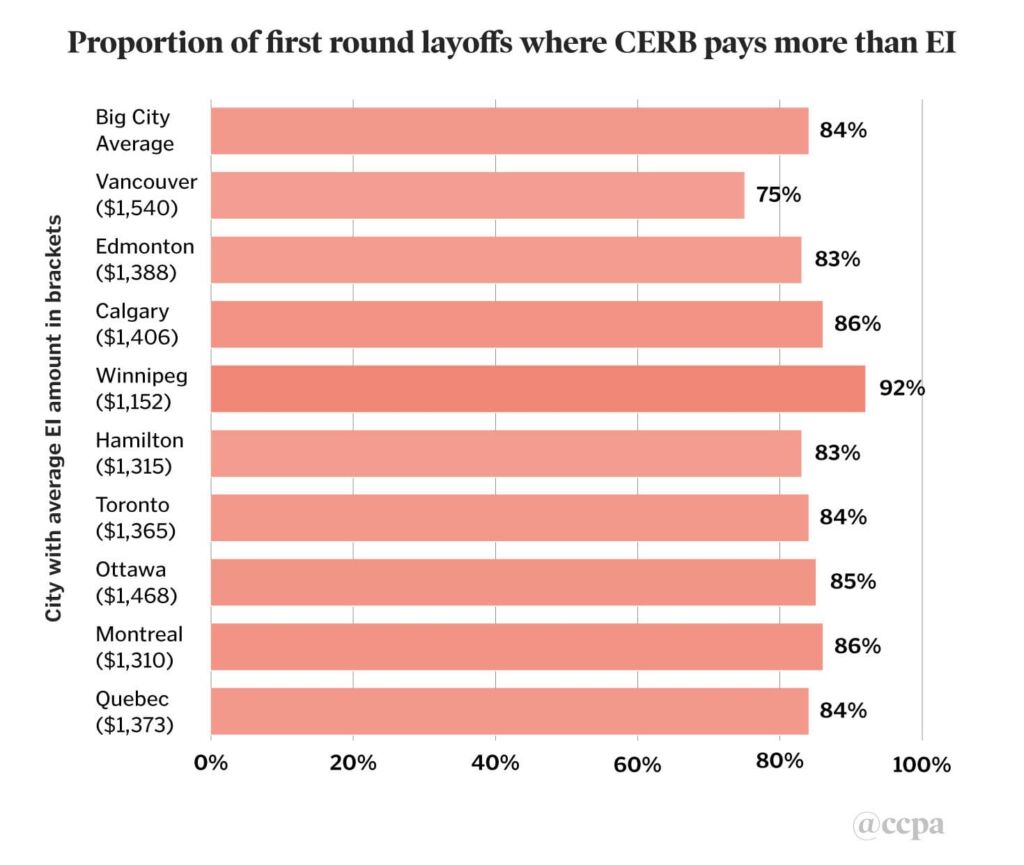
The good news: 84% of workers hit by layoffs in the first weeks of the crisis are better off with the CERB.¹ A quarter of laid off workers didn’t have enough hours to even qualify for EI, and for those who did qualify 78% would have received less from EI than from the CERB. The basic reason is that EI only replaces 55% of your income (no matter how low) so if you work full-time and make less than $21 an hour, the CERB will pay you more that EI.
For example, in Winnipeg, the average amount of EI a worker at risk of immediate layoff would receive is only $1,152 a month; under the CERB everyone receives $2,000. For the 16% of workers who would receive a higher EI amount which could be up to $573 a week ($2,482 a month, more than the $2,000 a month from the CERB), the flood of applications last week meant that payment would have been delayed for months. People facing the prospect of zero income might find it more helpful to get $462 a week immediately rather than waiting for $573 a week months from now.
Figure 1: Proportion of first round layoffs where CERB pays more than EI

Source: February 2020 LFS PUMF and author’s calculations. Includes self-employed. Average EI based on job tenure and usual weekly wage including the Family Supplement. Average EI for those who would qualify for EI.
The first round of COVID-19 layoffs came as a result of business closures necessary to stop the spread of the virus. Front line workers in four major industries: airlines; culture/recreation/sports; retail; and food/accommodations were hit first and hardest. Due to the rapidly changing business environment in provinces where closures continued to be announced into late March, the full impact of all layoffs won’t be known until the April Labour Force Survey (LFS) results are released in May.² This analysis relies on the February 2020 Labour Force Survey Public Use Microdata File (PUMF).
The workers most at risk of immediate layoff
This analysis focuses on the following categories of occupation³ within four major industries⁴ at the highest risk of immediate job losses from the pandemic. These are industries and professions that will be immediately impacted by forced business closures to slow the spread of the disease. In this analysis only the workers in these four industries and front-line occupations are considered at immediate risk of layoff in the first round of job loss following the start of the crisis. Together these categories comprise about two million workers.⁵
- Passenger airlines, and specifically the 46,000 workers in the “service representatives and other customer and personal services” category of the “transportation and warehousing” industry, which includes flight attendants and tickets salespeople.
- Arts, culture, recreation and sport, but mostly the technical and professional occupations of “arts, culture, sports and recreation” in the “information, culture and recreation” industry of the LFS, which includes 296,000 workers.
- The retail sector beyond those stores treated as essential in government decrees, such as grocery stores, drug stores and online sales, which may expand during the crisis. Only the “sales and service occupations” are included here, comprising 708,000 workers.
- Accommodation and food services, where, like in retail, only “sales and service occupation” employees are at immediate risk of layoff. Even if we exclude management, trades and transport workers in this sector, the category still includes 987,000 workers.
Figure 2 divides up all workers by income, not just those at immediate layoff risk. As we can see, those most likely to face layoffs in the immediate term are overwhelmingly lower-income workers while those at higher income levels are more secure. For example, 42% of all those making under $14 an hour work in the industries and occupations highlighted above and are at high risk of immediate layoff. For workers making between $14 to $16 an hour, 32% work in the high layoff risk areas. On the other hand, workers making over $40 an hour have a 1% chance of being in the initial layoff wave.
Though not shown in these figures, based on the same Labour Force Survey data we can estimate that a quarter of part-time workers are in the group at high risk of layoff, compared to 7% of full-time workers. Furthermore, 9% of all male workers and 13% of all female workers are in the high risk of layoff group.
Figure 2: Workers at risk of layoff in each category, by hourly income
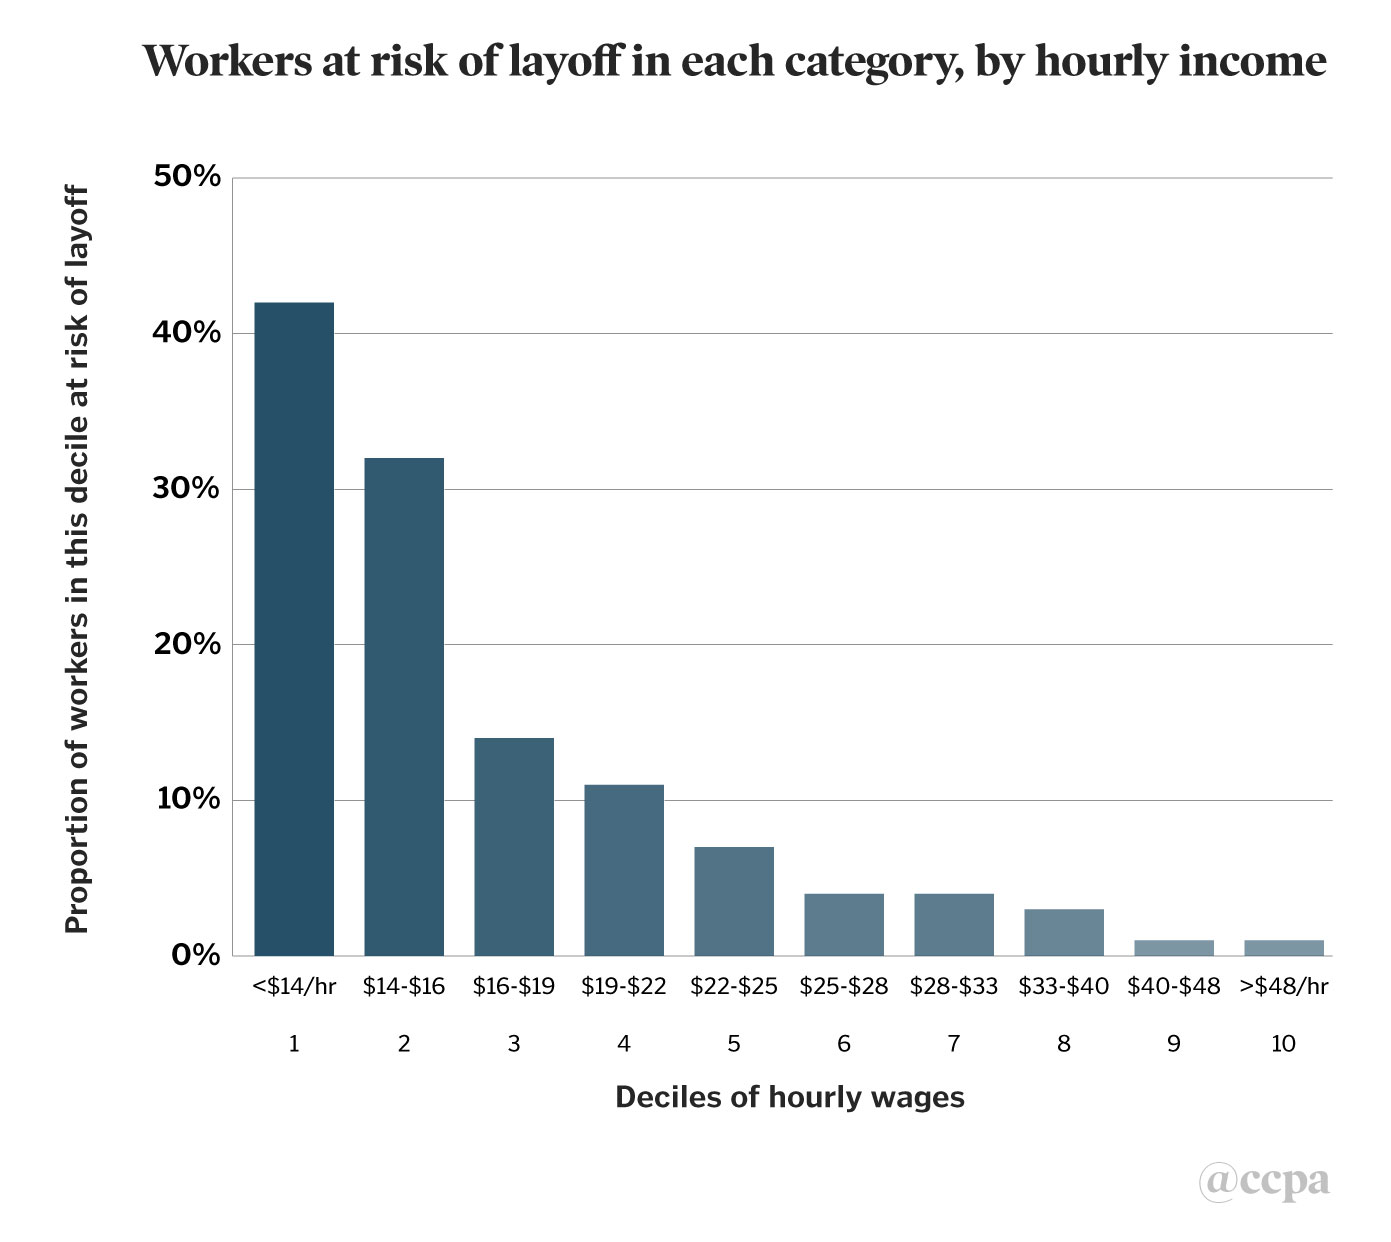
Source: Labour Force Survey PUMF, February 2020, excluding self-employed.
Impact on the unemployment rates
The reports of 929,000 EI claims in the third week in March provide a floor for what to expect with respect to the employment effects of COVID-19. However, the eventual numbers will almost certainly be higher as many people 1) may not yet have been laid off, 2) have not yet applied for EI, or 3) are waiting for a record of employment in order to apply. The replacement of EI by the CERB will likely accelerate new claims as the paperwork requirements are less onerous.
The Labour Force Survey, which tracks unemployment in Canada, was most recently conducted the week of March 16, the first week of mass layoffs. That data is to be released on April 9. However, the situation is still moving rapidly: people who may have been employed and surveyed on Monday could easily have been laid off by Wednesday. It’s likely not until the April data is collected and released at the start of May that we will see the full picture of what happened in the second half of March.
To estimate how COVID-19 layoffs will impact unemployment rates in Canada, this section outlines two scenarios in which it is assumed that a) 50% or b) 75% of those at risk of being laid off actually lose their jobs. The 50% scenario roughly matches known layoffs to date based on EI applications. Because all workers at risk haven’t been laid off as businesses have found ways to continue to operate in minimal ways (like restaurants converting to take-out only), the 75% scenario sets a mid-point between what we know already, and complete layoff of all at risk employees, which is a bit too pessimistic.
As shown in Table 1, the first scenario (50%) results in over a million people being laid off, which is close to what we’ve seen in the news this month and is therefore likely an optimistic estimate, or a floor, for what is really happening. The more probable Scenario 2 assumes that 75%—nearly 1.53 million workers—of those in the high-risk industry categories assessed in this analysis are laid off.
Keep in mind that these calculations assume no other layoffs in other sectors or other occupations and should therefore be treated as conservative estimates of the full impact of the COVID-19 emergency. Furthermore, the mass initial layoffs may push Canadians who were looking for a job in February completely out of the labour market in March. These discouraged job seekers would not be considered unemployed anymore but outside the labour force for the purposes of data collection, the effect of which has not been modeled here.
Initially workers may also be forced into involuntary part-time work and other forms of underemployment, or disguised unemployment, as employers scale back hours of work without layoffs. Given the uncertainty around the duration of the crisis and whether government assistance is on the way, many employers may have initially opted to formally retain workers but without shifts and earnings. If these employees go seven consecutive days without work or earnings, they might otherwise qualify for EI but aren’t technically laid off. So, once again, official unemployment rates may significantly understate the extent of the crisis.
Given the sheer number of workers potentially affected by layoffs, even in the optimistic scenario the impact on unemployment rates will be devastating. Nationally the unemployment rate stood at 5.9% in February 2020, the month before the crisis. It will at least double, to 10.9%, in Scenario 1—a level we have not seen in Canada since 1994.⁶ Most likely, however, that scenario is too optimistic. Under Scenario 2, unemployment jumps to something closer to 13.5% once the first wave of job losses is fully recorded, the highest we’ve seen since December 1982 and in fact the highest since at least the Second World War.⁸
Table 1 breaks down these staggering unemployment numbers by region, showing the February 2020 rate alongside those expected in scenarios 1 (optimistic) and 2 (probable). For example, while Newfoundland and Labrador’s unemployment rate was already above 13% in February, we can expect it to surge as high as 21.8%, leaving one-in-five workers out of a job. Quebec had the lowest unemployment rate in the country (5%) in February, but it could see that rate jump to 12.8% in the worst case, while Alberta’s elevated rate going into the COVID-19 crisis (7.5%) could fully double to 14.7%.⁸
Table 1: Projected unemployment rates and counts by province, city and age group
| Unemployment rates | ||||
| Feb 2020 | Optimistic case | Probable case | Newly unemployed - (probable) | |
| Canada | 5.9% | 10.9% | 13.5% | 1,528,050 |
| Provinces | ||||
| Newfoundland | 13.3% | 19.0% | 21.8% | 21,041 |
| Prince Edward Island | 10.0% | 14.5% | 16.7% | 5,677 |
| Nova Scotia | 8.7% | 14.8% | 17.8% | 45,877 |
| New Brunswick | 8.1% | 12.8% | 15.2% | 27,103 |
| Québec | 5.0% | 10.2% | 12.8% | 349,906 |
| Ontario | 5.5% | 10.3% | 12.6% | 564,174 |
| Manitoba | 5.2% | 10.2% | 12.7% | 51,479 |
| Saskatchewan | 6.2% | 11.2% | 13.6% | 45,014 |
| Alberta | 7.5% | 12.3% | 14.7% | 180,462 |
| British Columbia | 5.2% | 11.2% | 14.2% | 237,317 |
| Cities | ||||
| Quebec | 4.5% | 9.5% | 12.1% | 34,583 |
| Montreal | 5.2% | 10.7% | 13.4% | 192,167 |
| Ottawa | 4.4% | 9.2% | 11.6% | 43,485 |
| Toronto | 5.4% | 10.1% | 12.4% | 260,564 |
| Hamilton | 4.8% | 10.1% | 12.8% | 35,875 |
| Winnipeg | 5.0% | 10.4% | 13.2% | 38,703 |
| Calgary | 8.0% | 12.9% | 15.3% | 66,394 |
| Edmonton | 7.5% | 12.7% | 15.3% | 65,301 |
| Vancouver | 4.7% | 10.8% | 13.8% | 140,444 |
| Age Group | ||||
| <24 | 10.4% | 25.5% | 33.1% | 607,321 |
| 25-54 | 5.0% | 8.5% | 10.3% | 689,212 |
| >55 | 5.8% | 9.2% | 11.0% | 231,517 |
Source: Labour Force Survey PUMF, February 2020. Rates are not seasonally adjusted.
At the city level, both Edmonton and Calgary were already struggling in February 2020 before oil prices fell precipitously, with unemployment rates of 7.5% and 8.0% respectively. In the probable scenario, and excluding any further impact from oil prices, we could see unemployment rise to as much as 15.3% in both cities. Though Ottawa’s unemployment rate was a low 4.4% in February, it could more than double, to 9.2%, in Scenario 1, and hits 11.6% in the worst-case scenario.
In fact, the optimistic scenario has unemployment rates at least doubling in all major cities except Calgary and Edmonton. Canada’s big cities have large food, accommodation and retail sectors that would be heavily impacted. Those cities are relatively more reliant on these sectors than rural areas or smaller cities, and as a result would be harder hit in this first round of layoffs. Toronto could see a quarter of a million new unemployed in the worst-case scenario, with Montreal close behind at 192,000 and Vancouver at 140,000.
The toll this crisis takes on youth could be particularly harsh in this first round of COVID-19 layoffs. The youth unemployment rate (workers under 24) was already 10.4% in February. Even under the optimistic Scenario 1 (our likely current baseline given known EI applications) the youth unemployment rate increases to 25.5%. In the worst case it rises to 33.1%, producing a devastating situation where one in three youth who want a job wouldn’t be able to find one.
While the proportion of youth workers thrown out of work is much higher than for other age categories (see Figure 8), in terms of the number of jobs lost, prime working-age and older workers will make up the vast majority of unemployed.
Conclusion
Workers who bore the brunt of these first layoffs— youth, low paid, part-time workers and women -- have done so in order that we can all be safer by stopping the rapid spread of COVID 19. They certainly deserve our thanks and our support in the form of programs like the CERB, which is a vast improvement to what they would have received under EI, assuming they would have qualified. The federal government still needs to deliver on making sure the money flows as promised, but the CERB dramatically reinforces the EI safety net that was very frayed even before the outset of this crisis.
Footnotes
1. In order to determine EI eligibility a worker's tenure at their current job is multiplied by their usual hours at all jobs in February 2020. There is inherent inaccuracies here in that the usual hours in February may not have been the usual hours over the previous twelve months and there may not have been unemployment between a workers current job and their previous one. However, this likely suggest a lower bound for most workers’ EI eligibility. The EI amount for a worker is calculated as 55% of their usually hours worked in February 2020 times their hourly wage. A further adjustment is made for the 'Family Supplement' if incomes are low enough and the primary earner becomes is at risk of unemployment.
2. Statistics Canada’s Labour Force Survey was surveying Canadians the week of March 16. Those results would normally be due on April 9. However, the picture rapidly changed over the course of the second two weeks of March with successively severe business restrictions imposed by governments. As such, it won’t be until the April survey is released in early May that we’ll know the ultimate size of the initial round of COVID-19 layoffs.
3. Based on the Labour Force Survey NOC-10 and NOC-40 breakdowns.
4. North American Industry Classification System (NAICS) 2007 - Labour Force Survey. For categories, see: https://www23.statcan.gc.ca/imdb/p3VD.pl?Function=getVD&TVD=107003&CVD=107004&CPV=8.2&CST=01012007&CLV=1&MLV=7
5. Additional industries, such as the broader travel and auto sectors, will surely be hit in the first wave of layoffs. However, it isn’t possible to accurately disaggregate these industries and occupations using the LFS PUMF and therefore those workers are not included in the group at risk of layoff. This analysis does not analyze the impact of drastically lower oil prices on employment, particularly the western provinces, which will be significant.
6. Unemployment rates are unadjusted for seasonality to maintain comparability.
7. Projected unemployment rates in this analysis are not seasonally adjusted. The highest unadjusted unemployment rate in Canadian postwar history was 14.1%, reached in March 1983.
8. This analysis does not include the impact of the astonishing drops in oil prices that will certainly put additional pressures on employment in Alberta.
Thanks to Sheila Block, Angella MacEwen, Laurell Ritchie and Chris Roberts for their comments on an earlier draft of this analysis.