Medical Debt
Medical Debt in Dollars
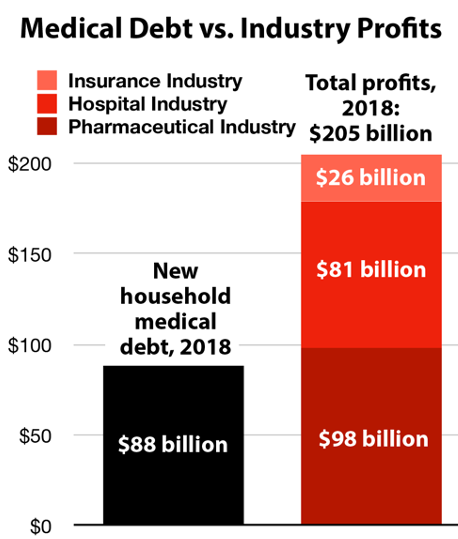
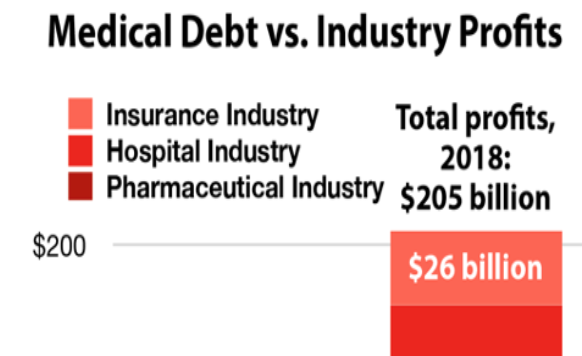
Total amount Americans borrowed to pay for health care, 2018 1
Profits of just 13 American pharmaceutical companies, 2018 2
Hospital industry profits, 2018 3
Health insurance industry profits just through the first three quarters of 2018 4
Pharmaceutical industry profits, 2000-2018 5
Total amount of medical debt seized from patients through debt collection, 2012 6
Average reported medical debt in collection in 2014. 61% of unpaid medical debts in collection are unpaid because people can’t afford them, and the rest because of the bureaucratic complexity of private health care financing: 24% don’t know they owe money and 21% lost track of their bill. 7
Percent of people with medical bill problems whose bill exceeded $10,000 in 2015 8
Percent of those with medical bill problems who’ve had difficulty paying other bills as a result of their medical debt in 2015 9
Number of adults (19-64) who have more than $10,000 in medical debt 10
Number of Americans who borrowed at least $10,000 for healthcare services in 2018 11
1 West Health and Gallup (2019), “The U.S. Healthcare Cost Crisis”
https://news.gallup.com/poll/248081/westhealth-gallup-us-healthcare-cost-crisis.aspx.
2 Belk, David (2020), “Pharmaceutical Financial Index”
https://truecostofhealthcare.org/pharmaceutical_financial_index/
3 Net profits are found by multiplying the hospital industry’s net revenue of $1.1918 trillion (from CMS) by its net profit margin of 6/8% (from MEDPAC). See Centers for Medicare & Medicaid Services (March 24, 2020), “NHE Fact Sheet,” https://www.cms.gov/Research-Statistics-Data-and-Systems/Statistics-Trends-and-Reports/NationalHealthExpendData/NHE-Fact-Sheet; Medicare Payment Advisory Commission (March 2020), “Hospital inpatient and outpatient services,”
http://www.medpac.gov/docs/default-source/reports/mar20_medpac_ch3_sec.pdf?sfvrsn=0
4 According to According to AM Best as cited in Business Wire (March 1, 2019), “Best’s Market Segment Report: U.S. Health Insurance Industry Sustains Strong Earnings Momentum in 2018"
https://www.businesswire.com/news/home/20190301005040/en/Best%E2%80%99s-Market-Segment-Report-U.S.-Health-Insurance
5 Ledley et al. (March 2020), “Profitability of Large Pharmaceutical Companies Compared With Other Large Public Companies,” JAMA
https://www.ncbi.nlm.nih.gov/pmc/articles/PMC7054843/
6 LaMontagne, Christina (2014), "Medical debt crisis worsening despite health care policy advances," NerdWallet Health,
https://assets.nerdwallet.com/blog/health/files/2014/10/NerdWallet-Health-study-Medical-debt-crisis-worsening-despite-health-care-policy-advances.pdf.
7 $579 according to the CFPB and 61% according to Consumer Reports. See Consumer Financial Protection Bureau (December 2014), "Consumer credit reports: A study of medical and non-medical collections,” https://files.consumerfinance.gov/f/201412_cfpb_reports_consumer-credit-medical-and-non-medical-collections.pdf.; Wang, Penelope (August 1, 2018), “Sick of Confusing Medical Bills?” Consumer Reports, https://www.consumerreports.org/medical-billing/sick-of-confusing-medical-bills/.
https://files.consumerfinance.gov/f/201412_cfpb_reports_consumer-credit-medical-and-non-medical-collections.pdf.
8 Hamel, Liz (January 5, 2016), "The Burden of Medical Debt: Results from the Kaiser Family Foundation/New York Times Medical Bills Survey," Kaiser Family Foundation
https://www.kff.org/report-section/the-burden-of-medical-debt-section-3-consequences-of-medical-bill-problems/
10 12% of 193.9 million adults. See Collins, Sara R., Herman K. Bhupal, and Michelle M. Doty (February 2019), “Health Insurance Coverage Eight Years After the ACA: Fewer Uninsured Americans and Shorter Coverage Gaps, but More Underinsured,” Commonwealth Fund
https://www.commonwealthfund.org/publications/issue-briefs/2019/feb/health-insurance-coverage-eight-years-after-aca.
Prevalence of Medical Debt
No one tracks medical debt comprehensively, but credit reports, debt collections and surveys all reveal that a huge portion of the country has been forced to go into debt in order to get health care, transferring enormous wealth from households to health care companies.
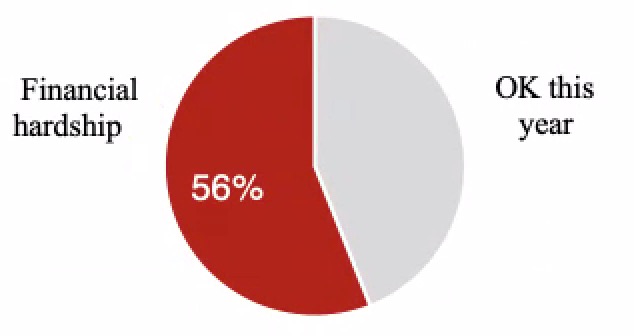
Number of U.S. adults experiencing medical financial hardship every year (56%), defined as medical debt, delaying care because of costs or worrying about medical bills. 79% of these people are insured 12
Percent of people with medical debt who landed in debt despite having health insurance 13
Number of U.S. adults (26%) experiencing “serious financial problems” due to health care costs over a two-year period (2013 to 2015) 14
No. of American adults (1 in 5) contacted each year by a debt collection agency about medical bills 15
Number of adults (1 in 4) paying off medical bills over time 16
Number of Americans with overdue medical debt on their credit reports (1 in 5) 17
Number of U.S. adults every two years (11%) who lose all or most of their savings to medical bills 18
Portion of households carrying credit card debt who cite medical expenses as a factor 19
Percent of total debt collections that come from medical expenses 20
Percent of U.S. household debt created by health care expenses 21
Amount Americans pay for medical debt compared to bank and credit card debt combined 22
Food insecurity rate among kids in households with medical debt compared to houses without debt 23
Portion of low- and middle-income households with medical debt who pay for basic expenses like rent or groceries using credit (borrowing at an average annual rate of 16.75%) 24
Reduction in medical debt among Michigan residents who gained coverage through Medicaid expansion 25
Adults (18-64) still reporting past-due medical debt in 2015 despite the Affordable Care Act 26
Lower likelihood of medical debt among low-income people who gained Medicaid coverage through the “Oregon Medicaid experiment.” They were also 81% less likely to end up with “catastrophic” out-of-pocket health care costs. 27
Reduction in adults (18-64) reporting past-due medical debt in 2015 after the Affordable Care Act expanded Medicaid and insurance subsidies, compared to 2012. In other words, 80.5% of medically indebted families either remained in debt or were not protected from new medical debt. 28
Lawsuits filed by the University of Virginia Health System against patient for $106 million in unpaid medical bills, including its own employees. The hospital company also won the ability to garnish thousands of low-wage workers’ wages and put liens on thousands of patients’ properties. 29
Medical debt erased by Methodist Le Bonheur hospital system for 5,300 low-income patients after an investigation by MLK50 and ProPublica 30
12 According to the Census Bureau, 28,565,542 people are uninsured. (137,100,000 – 28,565,542) / 137,100,000 = 79%. See Yabroff, K. Robin, Jingxuan Zhao, Xuesong Han, and Zhiyuan Zheng (August 1, 2019), “Prevalence and Correlates of Medical Financial Hardship in the USA,” Journal of General Internal Medicine 34, no. 8: 1494–1502, https://link.springer.com/article/10.1007/s11606-019-05002-w.; Census Bureau (2019), “Selected Characteristics of Health Insurance Coverage in the United States (TableID S2701),” 2018 ACS 1-Year Estimates Subject Tables
https://data.census.gov/cedsci/table?q=insurance&tid=ACSST1Y2018.S2701&hidePreview=false
13 Both Karpman and Pollitz find that 70% of people in medical debt had insurance when they incurred the debt. Himmelstein et al. find that the rate is 77.9%. See Karpman, Michael (May 21, 2015), "Most Adults with Medical Debt Had Health Insurance at the Time the Debt Was Incurred," Urban Instiute Health Policy Center, http://hrms.urban.org/briefs/Most-Adults-with-Medical-Debt-Had-Health-Insurance-at-the-Time-the-Debt-Was-Incurred.html; Pollitz, Karen (January 7, 2014), “Medical Debt Among People With Health Insurance,” Kaiser Family Foundation, https://www.kff.org/private-insurance/report/medical-debt-among-people-with-health-insurance/; Himmelstein, David U., Deborah Thorne, Elizabeth Warren, and Steffie Woolhandler (2009), “Medical Bankruptcy in the United States, 2007: Results of a National Study,” The American Journal of Medicine 122, no. 8: 6,
https://doi.org/10.1016/j.amjmed.2009.04.012.
14 According to a survey by NPR, Robert Wood Johnson Foundation and Harvard T.H. Chan School of Public Health, 26% of U.S. adults report “serious financial problems.” According to the Census Bureau, there were 227,019,486 adults 18 and over in 2016. 26% of 227,019,486 is 59,025,066. See NPR et al. (February 2016), "Patients’ Perspectives on Health Care in the United States: A Look at Seven States & the Nation,” https://media.npr.org/assets/img/2016/02/26/PatientPerspectives.pdf.; Census Bureau (October 28, 2016), “Electorate Profiles: Selected Characteristics of the Citizen, 18 and Older Population,”
https://www.census.gov/data/tables/time-series/demo/voting-and-registration/electorate-profiles-2016.html.
16 24.8% of adults 28+ according to Karpman & Caswell and 23% of adults 19-64 according to Collins et al. 23% of 193.9 million adults 19-64 is 44.6 million. See Karpman, Michael & Kyle J. Caswell (March 2017). “Past-Due Medical Debt among Nonelderly Adults, 2012–15,” Urban Institute, https://www.urban.org/research/publication/past-due-medical-debt-among-nonelderly-adults-2012-15; Collins et al. (February 2019), footnote 10.
17 Consumer Financial Protection Bureau (December 11, 2014), “CFPB Spotlights Concerns with Medical Debt Collection and Reporting,”
https://www.consumerfinance.gov/about-us/newsroom/cfpb-spotlights-concerns-with-medical-debt-collection-and-reporting/. https://www.consumerfinance.gov/about-us/newsroom/cfpb-spotlights-concerns-with-medical-debt-collection-and-reporting/.
18 Of the 26% of adults experiencing financial trouble, 42% lose their savings. 26% x 42% = 11.%. See NPR (February 2016), footnote 14. According the Census Bureau, the U.S. population 18+ was 255,271,738 in 2019. 11% x 255,271,738 = 28,079,891; Census Bureau (2020), “Age and Sex (Table ID: S0101),” 2019: ACS 1-Year Estimates Subject Tables
https://data.census.gov/cedsci/table?q=age&tid=ACSST1Y2019.S0101&hidePreview=false.
19 McElwee, Sean, (August 2016), “Enough to Make You Sick: The Burden of Medical Debt,” Demos
https://www.demos.org/publication/enough-make-you-sick-burden-medical-debt
21 "The Impact of Third-Party Debt Collection on the US National and State Economies in 2016." EY Building a Better World (November 2017).
https://www.acainternational.org/assets/ernst-young/ey-2017-aca-state-of-the-industry-report-final-5.pdf?viawrapper
23 Brewer, Mackenzie (2018), “Collateral Damage? How Household Debt Impacts Child Health and Development,” unpublished dissertation, Rice University
https://doi.org/10.3386/w25053.
25 Medical debt in collections. See Miller, Sarah, Luojia Hu, Robert Kaestner, Bhashkar Mazumder, and Ashley Wong (September 2018), “The ACA Medicaid Expansion in Michigan and Financial Health.” Cambridge, MA: National Bureau of Economic Research
https://doi.org/10.3386/w25053.
27 Baicker, Katherine, Sarah L. Taubman, Heidi L. Allen, Mira Bernstein, Jonathan H. Gruber, Joseph P. Newhouse, Eric C. Schneider, Bill J. Wright, Alan M. Zaslavsky, and Amy N. Finkelstein (2013), “The Oregon Experiment — Effects of Medicaid on Clinical Outcomes.” The New England Journal of Medicine 368, no. 18 : 1713–22
. https://doi.org/10.1056/NEJMsa1212321.
29 Hancock, Jay and Elizabeth Lucas (September 10, 2019), “‘UVA Has Ruined Us’: Health System Sues Thousands of Patients, Seizing Paychecks and Claiming Homes,” Kaiser Health News.
https://khn.org/news/uva-health-system-sues-patients-virginia-courts-garnishment-liens-bankruptcy/
30 Thomas, Wendi C. (October 2, 2020), “Profiting from the Poor: What Happens After a Debt Collection Machine Grinds to a Halt,” ProPublica.
https://www.propublica.org/article/what-happens-after-a-debt-collection-machine-grinds-to-a-halt
Bankruptcy
Medical bills are the single biggest factor forcing Americans to file for personal bankruptcy 31
Portion of family bankruptcies (67%) related to medical costs 32
Households declaring bankruptcy each year because of direct medical costs or job/income losses due to a medical condition 33
Percent of people declaring bankruptcy because of medical costs who had private insurance 34
Average out-of-pocket costs among families declaring bankruptcy for medical reasons, 2007 35
Percent of household bankruptcies caused at least in part by medical debt before and after the Affordable Care Act was implemented (in 2013 and in 2014-2015, respectively). The Affordable Care Act, drafted with cooperation from the health care industries, did almost nothing to rein in hospital, drug, and medical device prices, to streamline the administrative costs produced by multiple insurers, or to rein in premium, deductibles, and out-of-network fees for most people who have private insurance. 36
Average net worth of households declaring medical bankruptcy in 2007 37
31 Cahn, Susan (February 19, 2020), "Millions of Americans Donate through Crowdfunding Sites to Help Others Pay for Medical Bills,” NORC at the University of Chicago
, https://www.norc.org/NewsEventsPublications/PressReleases/Pages/millions-of-americans-donate-through-crowdfunding-sites-to-help-others-pay-for-medical-bills.aspx
32 Himmelstein, David U., Robert M. Lawless, Deborah Thorne, Pamela Foohey, and Steffie Woolhandler (March 2019), “Medical Bankruptcy: Still Common Despite the Affordable Care Act,” American Journal of Public Health 109, no. 3: 431–33
https://doi.org/10.2105/AJPH.2018.304901.
Who Has Been Indebted
Portion of people with medical debt who have private, employer-sponsored insurance 38
Portion of people without insurance, people with private insurance and people with Medicaid, respectively, who carry medical debt 39
Higher rate of medical debt among people on private insurance compared to people on Medicaid 40
Workers at firms with over 500 employees have outstanding medical debt 41
Percent of cancer patients forced into medical debt to get treatment 42
Percent of people declaring medical bankruptcy who lost or had to quit a job because of a medical event 43
Percent of households with medical debt who own less than $1,000 in liquid assets. These households have 164% higher odds of having medical debt than wealthier households 44
Percent of low-income adults reporting debt from care that was not covered by a health plan 45
Percent of middle-income adults who had medical debt in 2014 (compared with 25.6% lower income and 15.4% higher income) 46
Black Americans (age 18-64) with medical debt 47
Range of nonelderly adults reporting past-due medical debt across states, ranging from 5.9% in Hawaii to 37.4% in Mississippi 48
Portion of states with the highest rates of past-due medical debt that are in the South 49
Portion of seniors who have to pay more for out-of-pocket medical expenses than they have in non-housing assets in the last five years they’re alive. 25% have to pay more than their total assets. 50
Median out-of-pocket expense seniors living past age 95 have to pay after they pass their 70th birthday. The 95th percentile has to pay an average of $269,000. 51
39 Gunja, Munira Z., Sara R. Collins, David Blumenthal, Michelle M. Doty and Sophie Beutel (April 2017), “How Medicaid Enrollees Fare Compared with Privately Insured and Uninsured Adults: Findings from the Commonwealth Fund Biennial Health Insurance Survey, 2016,” The Commonwealth Fund
https://doi.org/10.15868/socialsector.27290
41 Salary Finance (2020), “Inside the Wallets of Working Americans – The 2nd Annual Salary Finance Report"
https://www.salaryfinance.com/us/2020-report/.
42 Gilligan, Adrienne (October 1, 2018), "Death or Debt? National Estimates of Financial Toxicity in Persons with Newly-Diagnosed Cancer," The American Journal of Medicine
https://www.amjmed.com/article/S0002-9343(18)30509-6/fulltext
44 Brewer, Mackenzie (2018), “Collateral Damage? How Household Debt Impacts Child Health and Development,” Rice University
https://scholarship.rice.edu/bitstream/handle/1911/105782/BREWER-DOCUMENT-2018.pdf.
50 Kelley, Amy S., Kathleen McGarry, Sean Fahle, Samuel M. Marshall, Qingling Du, and Jonathan S. Skinner (2010), “Out-of-Pocket Spending in the Last Five Years of Life,” National Bureau of Economic Research Bulletin on Aging and Health, no. 2: 3,
https://www.ncbi.nlm.nih.gov/pmc/articles/PMC3612877/pdf/nihms-313129.pdf.
51 Sudipto Banerjee (April 3, 2018), “Cumulative Out-of-Pocket Health Care Expenses After the Age of 70,”
https://www.ebri.org/health/publications/issue-briefs/content/cumulative-out-of-pocket-health-care-expenses-after-the-age-of-70.
Health Care Price Hikes
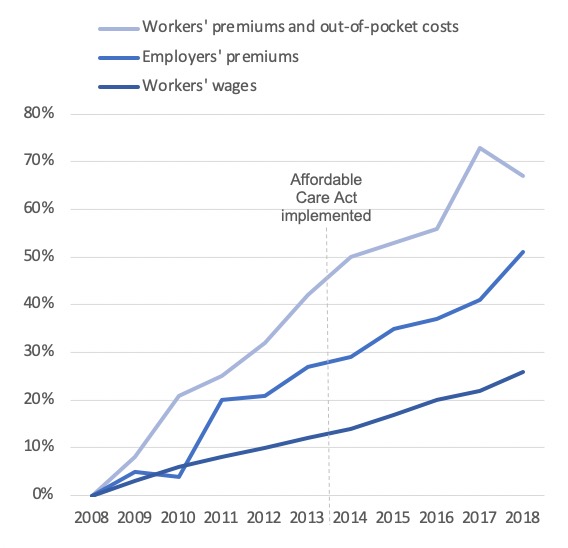
Percent increase in premiums for employer-sponsored insurance plans from 2008 to 2018. Workers’ average earnings increased during the same period by just 26%. 52
Projected growth in national health care expenditures, 2020-2027, at a 5.5% annual rate 53
Median wage growth, 2019 to 2020 54
Average increase in health care prices for patients and employers, 2019 to 2020 55
Average annual growth in workers’ premiums for employer-sponsored insurance plans from 2015 through 2018. Employers’ premiums increased by between 3.8% and 7.1% each year. 56
Average increase in drugs prices, 2019 to 2020 57
Average increase in the price of hospital expenditures, 2017 to 2020 58
Projected growth in households’ total out-of-pocket health expenses from 2020 to 2028 (growing at an annual rate of 4 to 4.3%) 59
Portion of adults (39%) who cannot afford an unexpected expense of $400. 27% would have to borrow money or sell something to afford the bill, and 12% wouldn’t be able to afford it at all. 60
Average annual cost of employer-sponsored insurance for a family of four in 2018 (including $15,159 in employer-paid premiums, which reduce workers’ pay, plus $7,726 paid directly by workers for premiums and out-of-pocket costs) 61
Out-of-pocket maximum allowed by the ACA for a family plan in 2020 62
52 Rae, Matthew (August 14, 2019), “Tracking the rise in premium contributions and cost-sharing for families with large employer coverage,” Peterson-KFF Health System Tracker
https://www.healthsystemtracker.org/brief/tracking-the-rise-in-premium-contributions-and-cost-sharing-for-families-with-large-employer-coverage/
53 Sisko, Andrea M., Sean P. Keehan, John A. Poisal, Gigi A. Cuckler, Sheila D. Smith, Andrew J. Madison, Kathryn E. Rennie, and James C. Hardesty (March 2019), “National Health Expenditure Projections, 2018–27: Economic And Demographic Trends Drive Spending And Enrollment Growth,” Health Affairs 38, no. 3: 491–501
https://doi.org/10.1377/hlthaff.2018.05499.
54 “Salary Budget Survey.” WorldatWork Total Rewards Association (July 8, 2019).
). https://www.worldatwork.org/docs/research-and-surveys/sbs/SBS2019_20_TopLevelData_NonParticipants.pdf
55 Girod, Christopher. "2020 Milliman Medical Index." Milliman (May 21st, 2020)
https://us.milliman.com/en/insight/2020-Milliman-Medical-Index
56 Centers for Medicare and Medicaid Services (2019), “Table 24: Employer-Sponsored Private Health Insurance,” 2018 National Health Expenditure Data
https://www.cms.gov/Research-Statistics-Data-and-Systems/Statistics-Trends-and-Reports/NationalHealthExpendData/NationalHealthAccountsHistorical.
57 Hopkins, Jared. “Drug prices rise 5.8% on average in 2020.” Market Watch (January 2, 2020).
https://www.marketwatch.com/story/drug-prices-rise-58-on-average-in-2020-2020-01-02
59 Centers for Medicare and Medicaid Services (April 14, 2020), “Table 5: Personal Health Care Expenditures by Source of Fund,” 2019-2028 National Health Expenditure Projections
https://www.cms.gov/Research-Statistics-Data-and-Systems/Statistics-Trends-and-Reports/NationalHealthExpendData/NationalHealthAccountsHistorical.
60 Board of Governors of the Federal Reserve System (May 2019), “Report on the Economic Well-Being of U.S. Households in 2018,”
https://www.federalreserve.gov/publications/files/2018-report-economic-well-being-us-households-201905.pdf.
61 Rae, Matthew, Rebecca Copeland, and Cynthia Cox (August 14, 2019), “Tracking the Rise in Premium Contributions and Cost-Sharing for Families with Large Employer Coverage,” Peterson-KFF Health System Tracker
https://www.healthsystemtracker.org/brief/tracking-the-rise-in-premium-contributions-and-cost-sharing-for-families-with-large-employer-coverage/.
62 “Out-of-pocket maximum/limit.” Healthcare.gov (2020)
https://www.healthcare.gov/glossary/out-of-pocket-maximum-limit/#:~:text=For%20the%202019%20plan%20year,and%20%2415%2C800%20for%20a%20family.
Surprise Medical Bills
Percent of American adults who have received unexpectedly expensive medical bills 63
Insured adults under 65 who receive an unexpected medical bill each year 64
Portion of insured adults with major medical bills in the last two years who had a billing problem like higher-than-expected charges, unclear statements, and bills arriving months late 65
Portion of insured adults with major medical bills in the last two years who ended up paying bills they weren’t even sure they owed because their coverage and bills were too confusing 66
Portion of adults under 65 with employer-sponsored insurance from a big employer who are billed out-of-network charges each year 67
People with unaffordable out-of-network medical bills who had no idea their provider was out-of-network. The other 3 in 10 knew but had limited options 68
Percent of Americans worried about unexpected medical bills 69
Nationwide portion of in-network admissions that led to an out-of-network bill from a surgeon, anesthesiologist or other provider 70
Portion of in-network hospital admissions billed with out-of-network charges in Alabama, California, Maryland, Nevada, New Jersey, and Texas. In Florida and Kansas, the rate is 1 in 4. In Minnesota, it is just 1.7%. 71
Portion of emergency department and independent lab charges, respectively, billed out-of-network to patients at in-network hospitals 72
Portion of elective inpatient visits for which patients receive a surprise medical bill 73
Portion of ambulance rides that are out-of-network. 26% of patients taking ambulances end up being billed out-of-network 74
Portion of inpatient hospital and emergency department admissions for which hospitals billed patients out-of-network in 2016, up from 27% (inpatient) and 32% (E.D.) in 2010 75
Likelihood an emergency inpatient admission was billed out-of-network, 2017 76
Percent of inpatient admissions that resulted in at least one out-of-network charge, 2017 77
Portion of total household out-of-pocket medical spending that goes to hospitals. Much larger amounts go to physicians, dental care, nursing care, prescription drugs, and medical equipment and supplies 78
Portion of mothers billed out-of-network for delivering their first baby 79
Portion of women on private insurance plans who regularly take prescription medicine yet in the last 12 months either had to pay a higher co-insurance or copay or had their insurance company drop coverage of their prescription altogether 80
Portion of privately insured Pennsylvanians who receive a surprise bill and tried to resolve the bill before paying it. Only 1 in 4 were able to do so satisfactorily 81
Although the Affordable Care Act places on annual cap on in-network out-of-pocket costs that patients have to pay, there is no legal limit on how much providers and insurers can charge through balance billing and out-of-network charges. 82
Portion of Americans supporting legislation to protect patients from surprise medical bills, 2017 83
Amount spent on television ads in 2019 by two private equity firms, Blackstone Group Inc. and KKR & Co., to block legislation protecting patients from surprise medical bills 84
Bills passed by Congress to protect privately insured patients from surprise billing by hospital, insurance, lab, and other health care companies. Public insurance programs, including Medicare, Medicaid, and the VA, protect people from surprise billing 85
64 Pollitz, Karen, Matthew Rae, Gary Claxton, Cynthia Cox, and Larry Levitt (February 10, 2020), “An Examination of Surprise Medical Bills and Proposals to Protect Consumers from Them,”
https://www.healthsystemtracker.org/brief/an-examination-of-surprise-medical-bills-and-proposals-to-protect-consumers-from-them-3/.
68 Pollitz, Karen (March 2016), “Surprise Medical Bills,” Kaiser Family Foundation
, https://www.kff.org/private-insurance/issue-brief/surprise-medical-bills/
71 Kevin Kennedy, William Johnson and Jean Fuglesten Biniek (March 28, 2019), “Surprise Out-of-Network Medical Bills during in-Network Hospital Admissions Varied by State and Medical Specialty, 2016,” Health Care Cost Institute,
https://healthcostinstitute.org/out-of-network-billing/oon-physician-bills-at-in-network-hospitals.
73 Garmon, Christopher, and Benjamin Chartock (January 2017), “One In Five Inpatient Emergency Department Cases May Lead To Surprise Bills,” Health Affairs 36, no. 1: 177–81
https://doi.org/10.1377/hlthaff.2016.0970.
75 Sun, Eric C., Michelle M. Mello, Jasmin Moshfegh, and Laurence C. Baker (August 12, 2019), “Assessment of Out-of-Network Billing for Privately Insured Patients Receiving Care in In-Network Hospitals,” JAMA Internal Medicine.
https://doi.org/10.1001/jamainternmed.2019.3451.
78 Center for Medicare and Medicaid Services (December 17, 2019), “Table 04 National Health Expenditures by Source of Funds and Type of Expenditures (2018),”
https://www.cms.gov/Research-Statistics-Data-and-Systems/Statistics-Trends-and-Reports/NationalHealthExpendData/NationalHealthAccountsHistorical.
79 Chartock, Benjamin, Christopher Garmon, and Sarah Schutz (March 2019), “Consumers’ Responses To Surprise Medical Bills In Elective Situations.” Health Affairs 38, no. 3): 425–30
https://doi.org/10.1377/hlthaff.2018.05399.
80 Kaiser Family Foundation (March 2018), “Coverage, Access, and Affordability: Key Findings from the 2017 Kaiser Women’s Health Survey,”
http://files.kff.org/attachment/Issue-Brief-Womens-Coverage-Access-and-Affordability-Key-Findings-from-the-2017-Kaiser-Womens-Health-Survey.
81 Altarum Health Care Value Hub (June 2019), “Many Privately-Insured Pennsylvanians Receive Unexpected Medical Bills; Fully One-Third Unhappy with Resolution, May Not Understand Options for Assistance,"
," https://www.healthcarevaluehub.org/advocate-resources/publications/many-privately-insured-pennsylvanians-receive-unexpected-medical-bills-fully-one-third-unhappy-resolution-may-not-understand-opt
82 “Out-of-pocket maximum/limit.” Healthcare.gov (2020).
https://www.healthcare.gov/glossary/out-of-pocket-maximum-limit/#:~:text=For%20the%202019%20plan%20year,and%20%2415%2C800%20for%20a%20family.
84 Dezheimer, Elizabeth (January 8, 2020), “Blackstone-KKR Hidden Hand in Ad Blitz Unleashes Washington Fury,” Bloomberg
https://www.bloomberg.com/news/articles/2020-01-08/blackstone-kkr-hidden-hand-in-ad-blitz-unleashes-washington-fury.
85 Hoadley, Jack, Kevin Lucia, and Katie Keith (April 2, 2020), “Keeping Surprise Billing Out Of Coronavirus Treatment,” Health Affairs Blog
https://www.healthaffairs.org/do/10.1377/hblog20200330.353921/full/.
Crowdfunding to Cover Medical Bills
86 Advisory.com (July 10, 2018), "1 in 3 GoFundMe campaigns is for medical bills, CEO says,"
https://www.advisory.com/daily-briefing/2018/07/10/gofundme
87 Helhoski, Anna (November 2, 2016), "Just 11% of Medical Crowdfunding Campaigns Are Fully Funded, Study Finds,” Nerdwallet.
https://www.nerdwallet.com/blog/studies/study-few-medical-campaigns-funded-bankruptcy/