Relative to what they need, Pennsylvania’s poorest school districts receive 35% less funding than its richest. The incredible inequities in the economic fortunes of Pennsylvania’s 500 school districts are not overcome by the current attempts by the state and federal government to provide poorer districts with more funding. Need-adjusted total spending per student in the poorest quintile of PA’s school districts, $11,723, is dwarfed by the $18,078 need-adjusted spending per student in the richest quintile.
This paper explains how we reach this conclusion. We define, in turn, what we mean by “quintile” of school districts and “poorest quintile of school districts” and then show how we calculate total funding in each school district and adjust it for need.
Quintiles could each contain one-fifth of the state’s school districts, but this way of dividing schools would lead to some quintiles educating more than twice as many students as others. Instead, in this analysis, each quintile is a set of school districts that educate about one-fifth of all students in PA. Our measure of the number of students in a district is the district’s Average Daily Membership (ADM), which is the average number of students who attend school each day.
To measure school district poverty, we use estimates of the number of school-age children in the school district who live in poverty. These estimates come from the Small Area Income and Poverty Estimates (SAIPE) program of the Census and specifically deal with children ages 5 to 17. There are other measures of poverty that could be used, such as census estimates for the total number of people in poverty in the district, the median income or median property value in the district, etc. While these measures might be more useful if we were looking at a school district’s ability to raise funds locally because this analysis is focused on the equity of current funding, the measure that most directly measures the economic fortunes of the children receiving the education is most appropriate. The appendix goes into more detail about how we create these quintiles.
A school district’s funding is taken to be the sum of its 2019-20 local, state, and federal revenue according to the Pennsylvania Department of Education (PDE) summary data. Revenue from “other sources” is left out as is common when comparing school district funding. Revenue from “other sources” includes money from refinancing and such. This income is usually one-time funding that may be important for balancing school district budgets but does not represent funds the school districts regularly spend on student education.
Not each school district needs as much money as every other. An intuitive measure of school district need would be the number of students in each school district. Philadelphia City School District educates more than 239,000 students while Greenwood School District educates around 800. Clearly, Philly SD needs more money. The Average Daily Membership (ADM) alone, though, tells an incomplete story. As the 2007 costing-out study found, various factors can have a significant impact on how much money is needed to give children an adequate education. Poverty and English language proficiency are two of the most important. The importance of these factors has repeatedly been enshrined by the legislature in state funding of public schools over the past two decades, most recently in the Fair Funding Formula and in the Level Up program. A school district’s “student-weighted ADM” is the ADM of the school district with extra weight given to students to better reflect how much money is needed to educate them, and therefore serves as a much better measure of relative school district funding needs than ADM. Student-weighted ADM is taken from the 2021-22 Estimated Basic Education Funding file published by the PDE.
The findings are presented in table 1, which displays for each quintile of school districts by the density of children in poverty how much funding school districts receive from local, state, and federal sources per student weighted ADM (S-W ADM), both broken out by funding source and summed together. This is a need-relative comparison of school district funding. Table 1 also presents the total ADM and the overall share of school-age children in poverty for each quintile.
Table 1. School district funding per weighted student by quintile based on the percent of school-age children in poverty
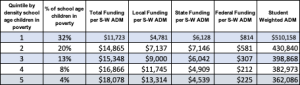
School districts with fewer children in poverty have much higher local funding per student-weighted ADM than districts that educate more children in poverty because such school districts have a wealthier tax base than the average school district. Though state and federal programs generally give poorer school districts more money per student-weighted ADM, it is not nearly enough to counterbalance the inequities that exist at the local level.
The local inequities are not just in local funding but also in local need. Because children in poverty require more resources to receive an adequate education, school districts in the poorest quintile need significantly higher funding than the richest school districts. Despite ADMs that differ by less than 3%, the student-weighted ADM of the poorest quintile of school districts is 38% larger than the student-weighted ADM of the richest school districts. State and federal funding almost make up for the disparity in the raw dollar amount received from local funds by different quintiles of school districts. As shown in the appendix, total funding for the richest school districts is only 9% greater than that of the poorest school districts, even though they receive almost twice as much local funding. It is when funding is put in the context of school district funding need, in this case as measured by student-weighted ADM, that it is clear the richest school districts receive 54% more funding relative to need than poorer school districts.
Poverty challenges school districts from two sides. It makes it harder for them to raise their own funds locally while simultaneously necessitating more funding. Though slanted towards poorer school districts, state and federal funding does not do enough to counterbalance the combined effects of poverty on school district local funding and funding need. The current state of school district funding leaves Pennsylvania’s most vulnerable children to be educated by school districts least able to financially provide for those students’ education.
Appendix-Quintiles
All school districts are ranked according to the percentage of school-age children in the district that are estimated to be in poverty, with the highest density of children in poverty being ranked in quintile 1. The ADM of all lower-ranked school districts is summed and divided by one-fifth of statewide ADM. The floor of this number plus 1 is the school district’s quintile. In effect, we are putting school districts into the poorest quintile until that quintile has been “filled” with at least one-fifth of the statewide ADM; then we put school districts into the second quintile until the first two quintiles combined have at least two-fifths of the statewide ADM, etc. Producing quintiles this way creates quintiles that all differ from one-fifth of the statewide ADM by less than 3% (Table 2).
Table 2. School district funding by quintile based on the percent of school-age children in poverty

The total funding received by school districts per quintile. ADM, funding, quintiles, and poverty measures are all the same as described in the body. Note that local funding of the richest quintile is almost twice that of the poorest, and total funding is still off by 9%.